
Shapa health
Admin portal for medical partners
A 0 → 1 initiative transforming fragmented workflows into a scalable enterprise patient management platform
A 0 → 1 initiative transforming fragmented workflows into a scalable enterprise patient management platform
Platforms
Web environment
Timeline
3 months duration
Teams
Product, Engineering and QA
My role
In a 0→1 build, I led the design of Shapa’s Admin Portal, creating a centralized system for enterprise clients to monitor and manage patient health at scale. I combined research insights with systems thinking to define role-based environments, flexible data views, and task-oriented navigation. Working in a highly collaborative environment with product, engineering, and data, I navigated technical constraints and iterated on complex data components to ensure both usability and scalability. I drove the project from discovery through implementation, delivering a platform that reduced reliance on support and enabled more efficient, action-oriented workflows.
Impact
-60%
Reduction in support tickets
< 30 sec
Report generation time
Real-time
Patient monitoring & insights
Project overview
Shapa partners with enterprise clients such as HMOs, insurance companies, and eating disorder clinics to support patients’ health journeys through a personalized app.
As Shapa scaled its enterprise offering, clients struggled to manage patient data efficiently, relying heavily on manual reports and support requests.
I led the design of Shapa’s first Admin Portal: transforming fragmented workflows into a centralized, data-driven platform that enables organizations to monitor, manage, and engage their patients at scale.
Problem
Enterprise clients lacked a centralized system to manage their patients.
This resulted in:
Fragmented visibility across users and health data
Heavy reliance on support for accessing reports and insights
Inefficient workflows that slowed down treatment management
Research
Key Questions
What do enterprise clients actually need to manage patients effectively?
Where are they experiencing friction-and how severe is it?
How can we reduce dependency on support while improving outcomes?
Methods
Quantitative and qualitative support data
Guerrilla research
In-person stakeholder interviews
01
No holistic view of patients
Clients couldn’t easily monitor progress across individuals or groups
02
Limited access to data
Downloadable reports were hard to access, delayed, or required support
03
Lack of engagement tools
No way to communicate with patients or assign actions directly
04
Different user roles, same system
Two distinct personas emerged:
Admin (day-to-day patient management)
Super Admin (higher-level configuration & oversight)
Key insights
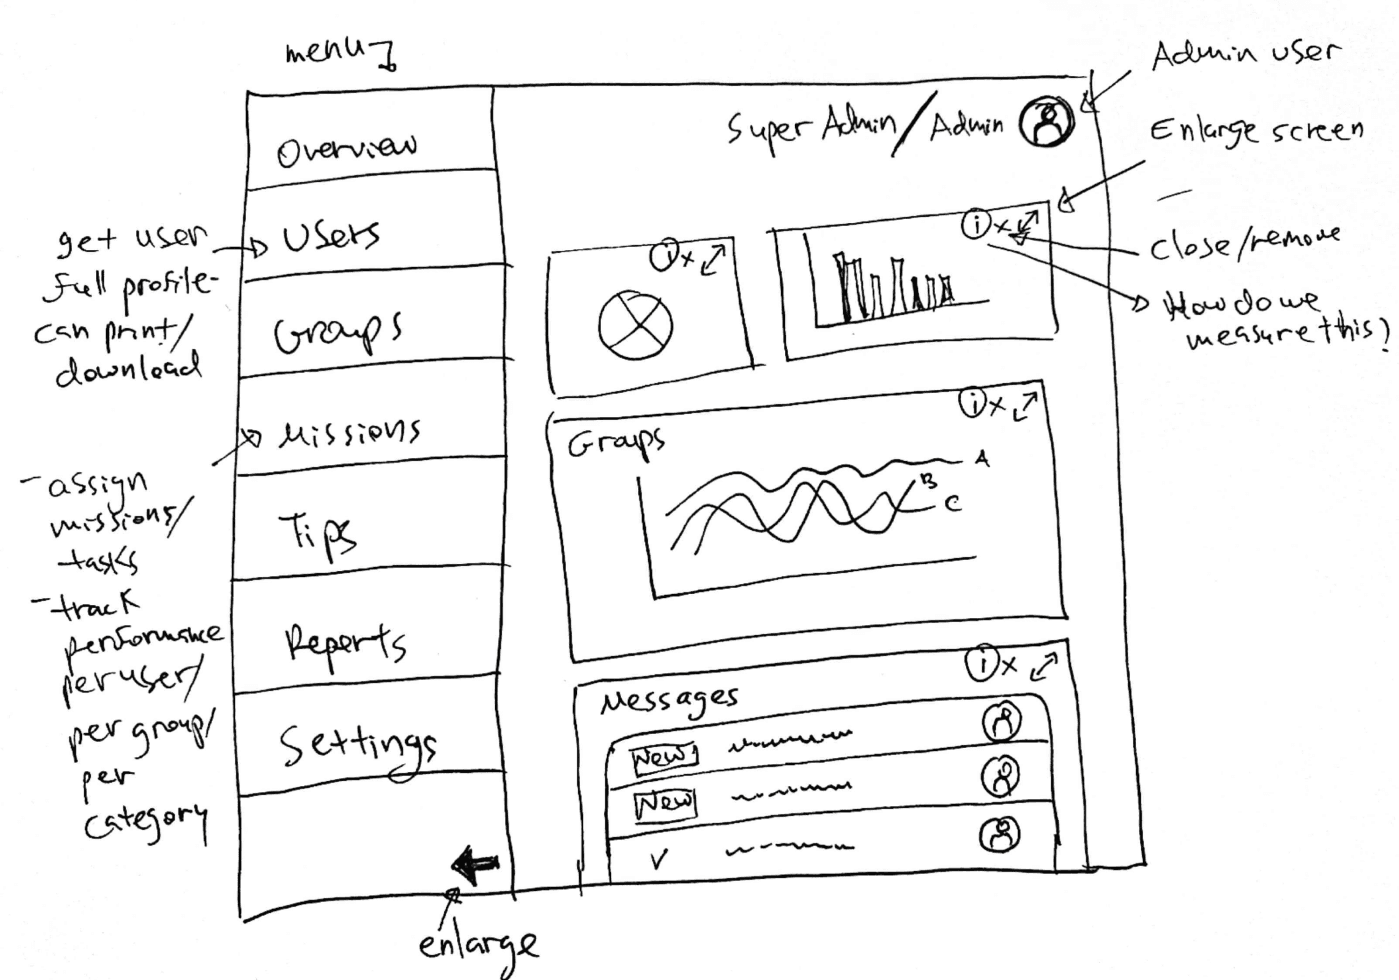
Prototyping
After mapping out the proposed concept in rough sketches, I moved into building the design system before touching any screens. Starting with the core components - buttons, badges, stat cards, and table rows - meant that by the time I assembled the full dashboard, every element already had a clear visual language and purpose. This approach kept the interface consistent across all views (Admin and Super Admin) and reduced cognitive overload for clinicians who needed to scan large amounts of patient data quickly. Each block was designed to answer one question: what does the admin need to act on right now?
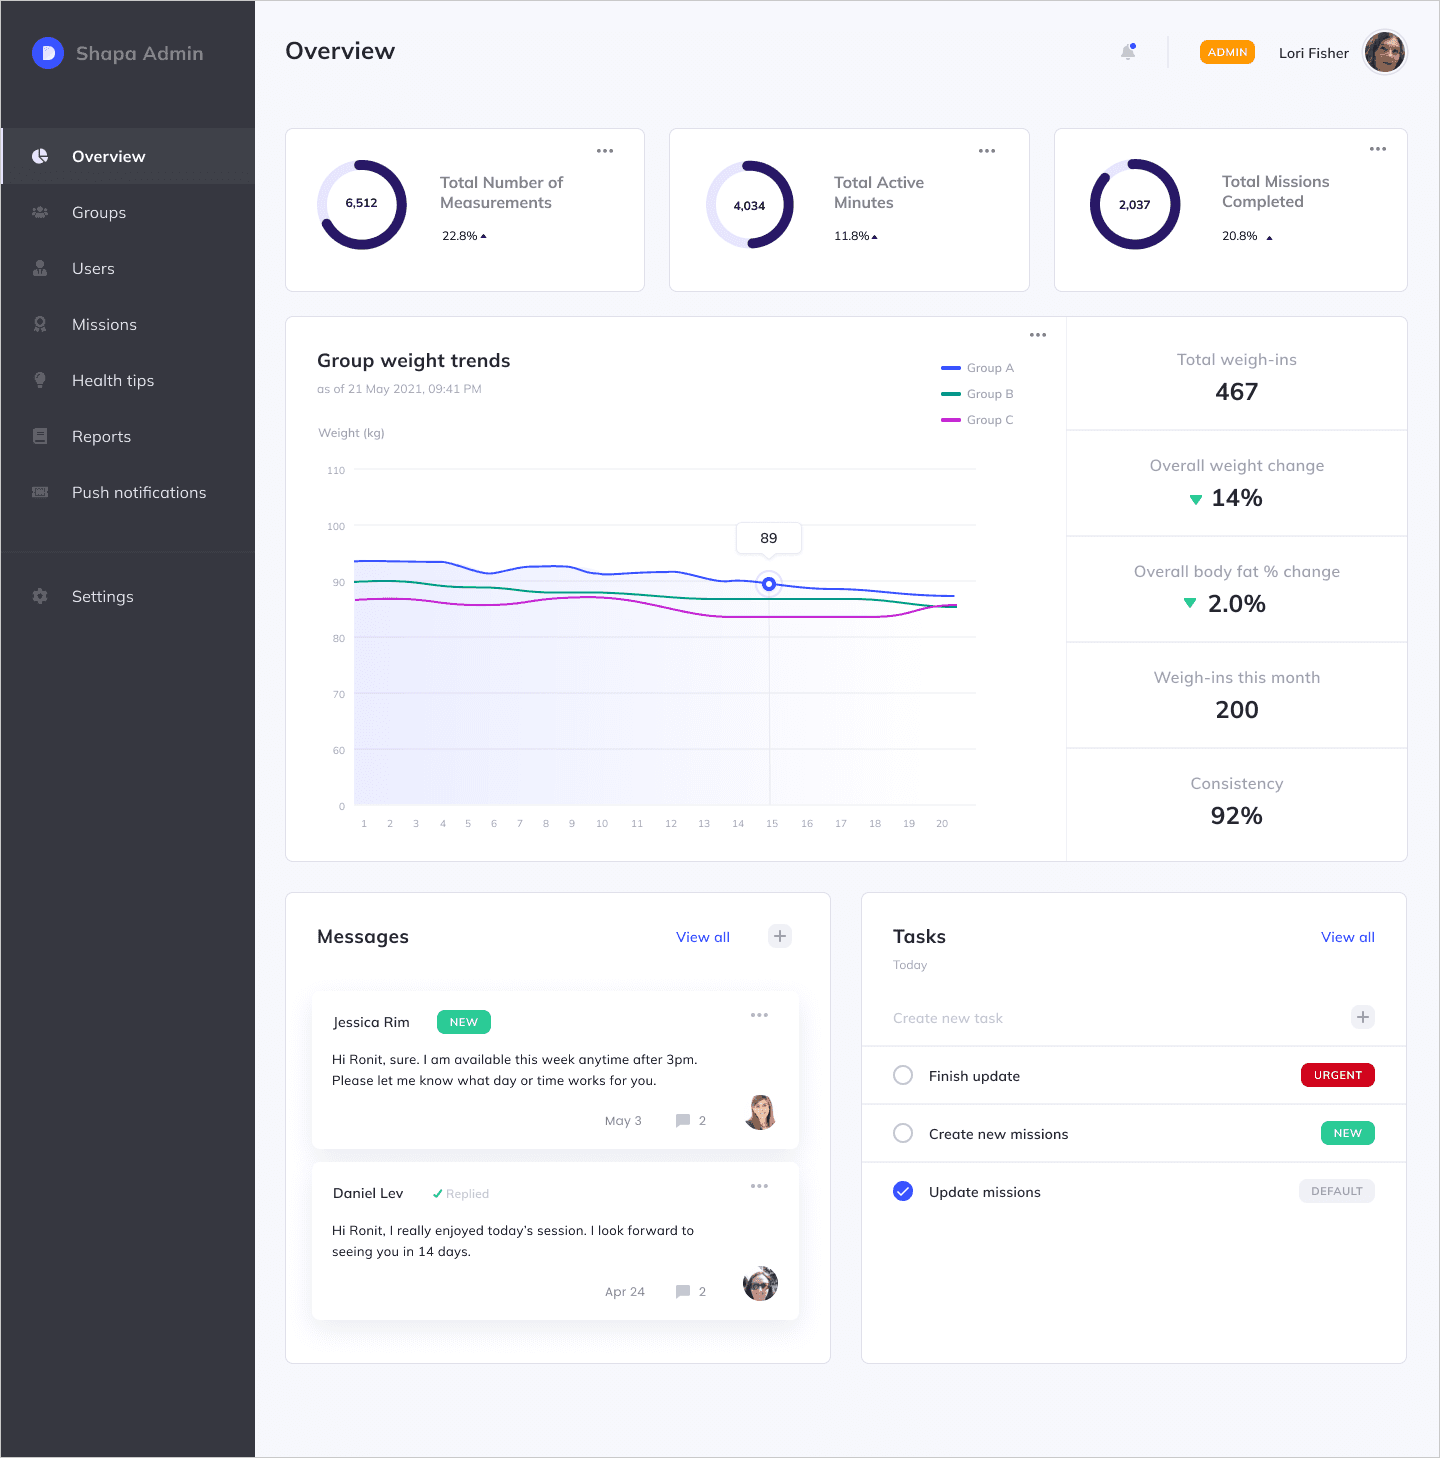
Final design
The final experience focused on clarity, flexibility, and usability- organizing tasks and UI based on users’ mental models and validated behaviors.
Strategic direction
Enable enterprise clients to independently monitor, manage, and engage patients at scale.
This led to three strategic pillars:
Centralization – one place for all patient data
Self-service – reduce reliance on support
Actionability – turn data into meaningful interventions
Problem
Enterprise clients lacked a centralized system to manage their patients.
This resulted in:
Fragmented visibility across users and health data
Heavy reliance on support for accessing reports and insights
Inefficient workflows that slowed down treatment management
Research
Key Questions
What do enterprise clients actually need to manage patients effectively?
Where are they experiencing friction-and how severe is it?
How can we reduce dependency on support while improving outcomes?
Methods
Quantitative and qualitative support data
Guerrilla research
In-person stakeholder interviews
Key insights
01
No holistic view of patients
Clients couldn’t easily monitor progress across individuals or groups
02
Limited access to data
Downloadable reports were hard to access, delayed, or required support
03
Lack of engagement tools
No way to communicate with patients or assign actions directly
04
Different user roles, same system
Two distinct personas emerged:
Admin (day-to-day patient management)
Super Admin (higher-level configuration & oversight)
Strategic direction
Enable enterprise clients to independently monitor, manage, and engage patients at scale.
This led to three strategic pillars:
Centralization – one place for all patient data
Self-service – reduce reliance on support
Actionability – turn data into meaningful interventions
Prototyping
After mapping out the proposed concept in rough sketches, I moved into building the design system before touching any screens. Starting with the core components: buttons, badges, stat cards, and table rows- meant that by the time I assembled the full dashboard, every element already had a clear visual language and purpose. This approach kept the interface consistent across all views (Admin and Super Admin) and reduced cognitive overload for clinicians who needed to scan large amounts of patient data quickly. Each block was designed to answer one question: what does the admin need to act on right now?
Final design
The final experience focused on clarity, flexibility, and usability- organizing tasks and UI based on users’ mental models and validated behaviors.
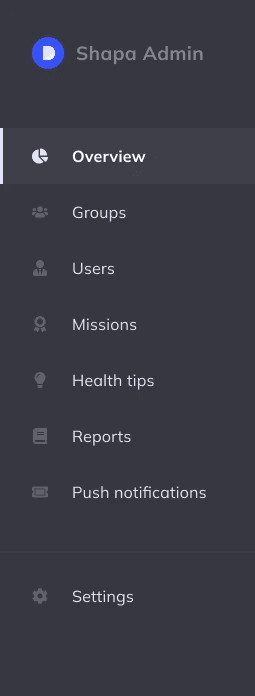
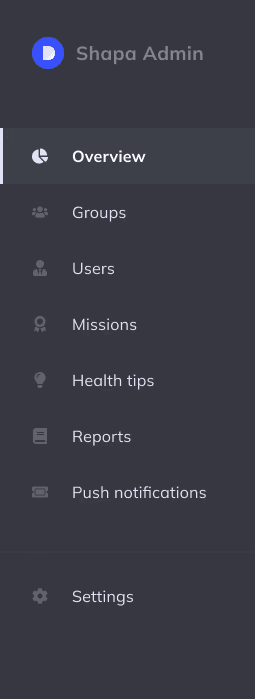
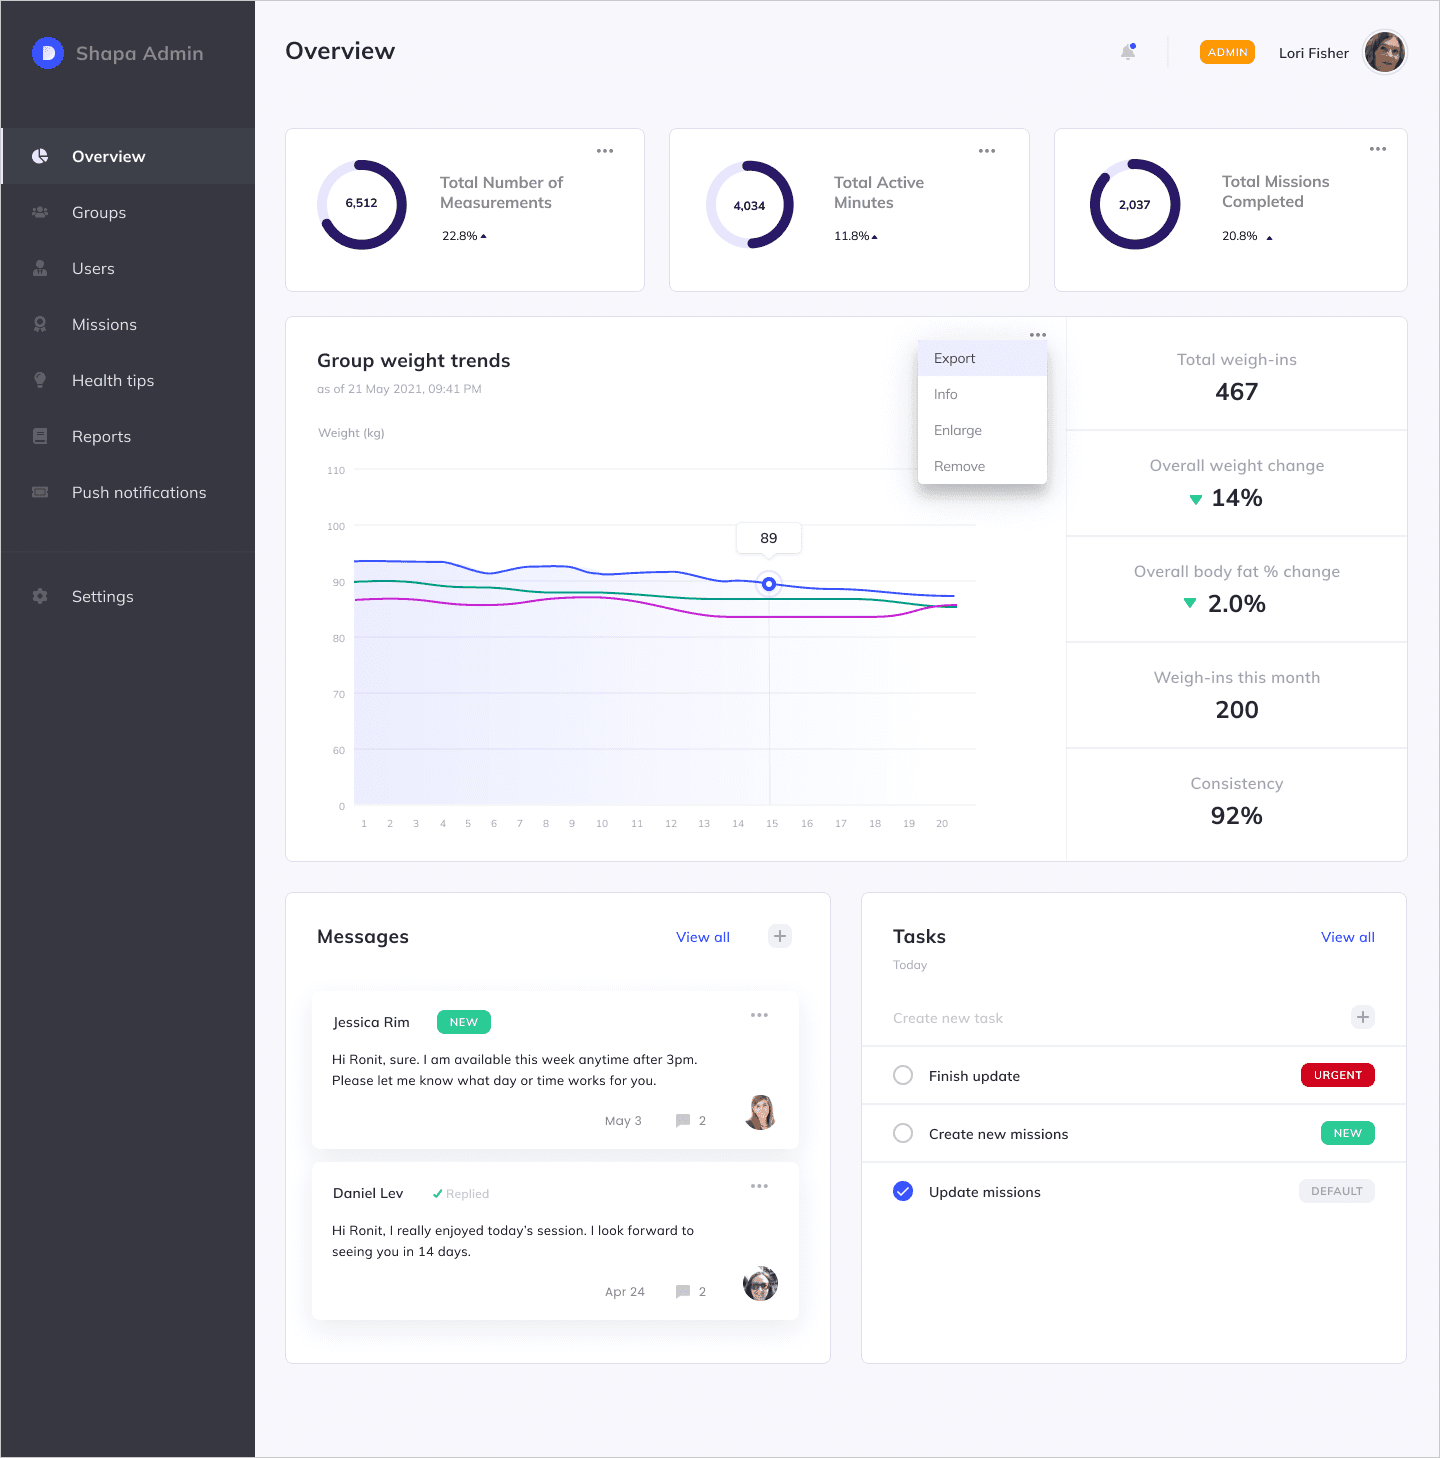
Flexible, task-oriented navigation
Navigation structured around core user tasks
Reduced cognitive load and improved efficiency
I choose dark color to reduce contrast fatigue during long monitoring sessions and visually separates nav chrome from patient data.Ability to create multiple dashboard pages and place charts contextually
Prototyping
Flexible, task-oriented navigation
After mapping out the proposed concept in rough sketches, I moved into building the design system before touching any screens. Starting with the core components - buttons, badges, stat cards, and table rows - meant that by the time I assembled the full dashboard, every element already had a clear visual language and purpose. This approach kept the interface consistent across all views (Admin and Super Admin) and reduced cognitive overload for clinicians who needed to scan large amounts of patient data quickly. Each block was designed to answer one question: what does the admin need to act on right now?
Reduced cognitive load and improved efficiency
I choose dark color to reduce contrast fatigue during long monitoring sessions and visually separates nav chrome from patient data.Ability to create multiple dashboard pages and place charts contextually
Prototyping
Role-based environments
Separate experiences for Admin and Super Admin
Tailored permissions and workflows based on responsibilities


Final design
Flexible, task-oriented navigation
Navigation structured around core user tasks
Reduced cognitive load and improved efficiency
I choose dark color to reduce contrast fatigue during long monitoring sessions and visually separates nav chrome from patient data.Ability to create multiple dashboard pages and place charts contextually

Role-based environments
Separate experiences for Admin and Super Admin
Tailored permissions and workflows based on responsibilities
Final design
Flexible, task-oriented navigation
Navigation structured around core user tasks
Reduced cognitive load and improved efficiency
I choose dark color to reduce contrast fatigue during long monitoring sessions and visually separates nav chrome from patient data.Ability to create multiple dashboard pages and place charts contextually
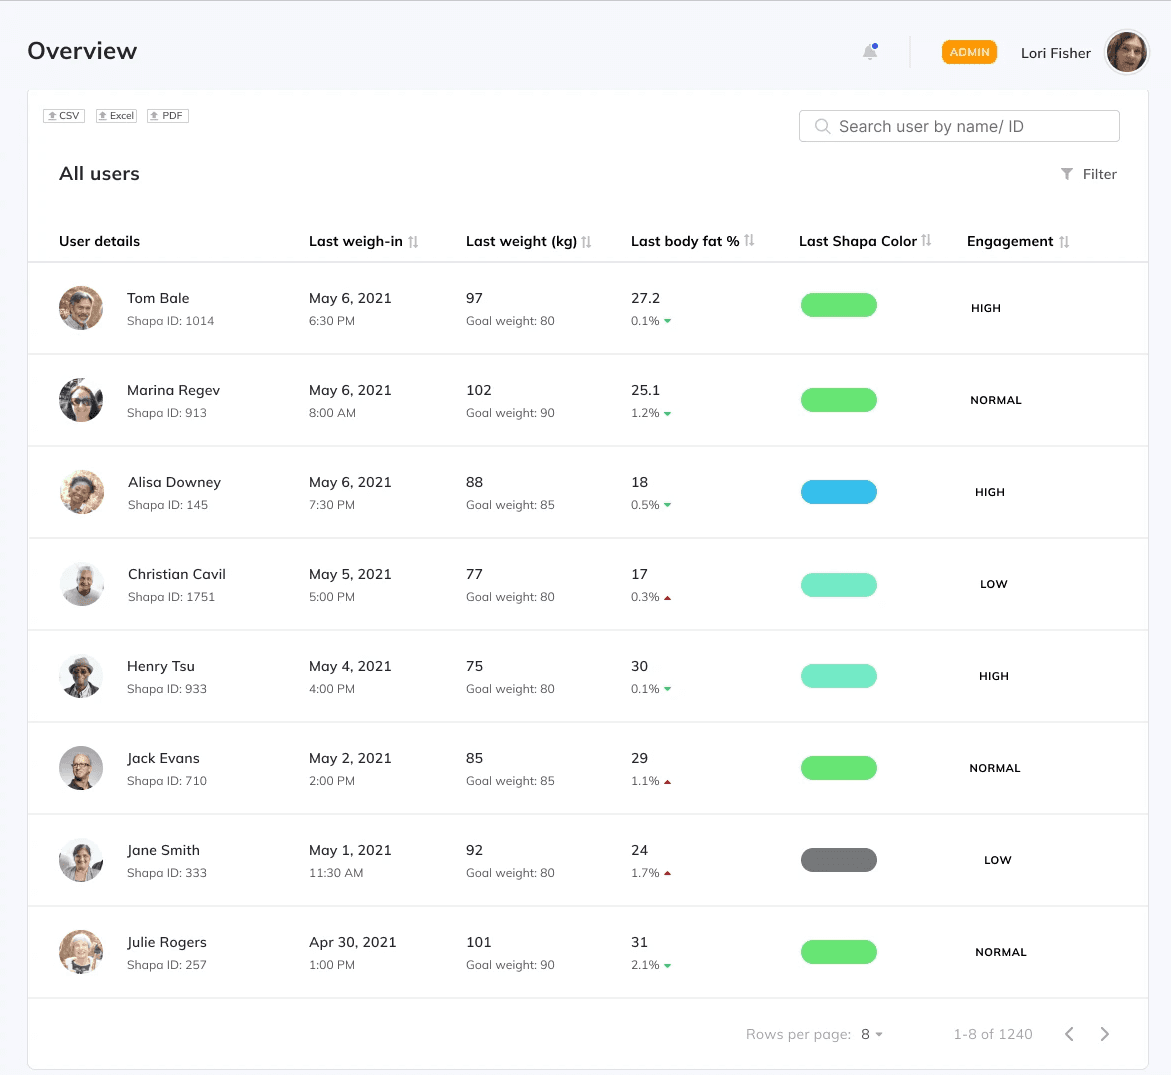

Centralized patient management
Unified view of all patients
Ability to monitor health progress and weight trends at both group and individual levels
Self-service data access
Quick export functionality
Easy access to previously hard-to-reach reports
Centralized patient management
Unified view of all patients
Ability to monitor health progress and weight trends at both group and individual levels
Self-service data access
Quick export functionality
Easy access to previously hard-to-reach reports
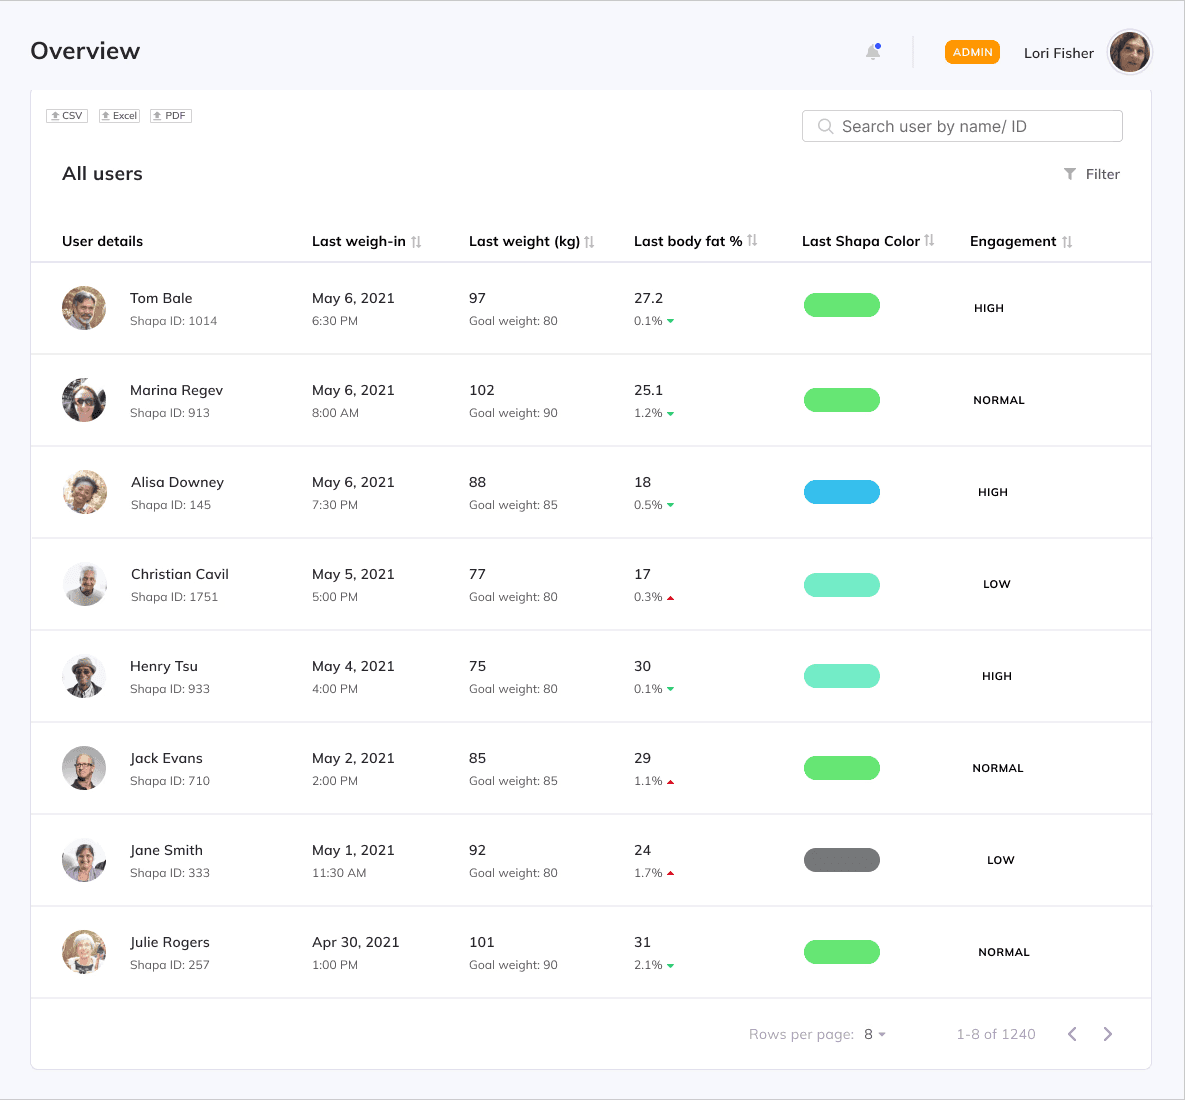
Customizable dashboard
Admins can configure views and remove irrelevant fields
Supports different workflows across organizations

Customizable dashboard
Admins can configure views and remove irrelevant fields
Supports different workflows across organizations
Project overview
Shapa partners with enterprise clients such as HMOs, insurance companies, and eating disorder clinics to support patients’ health journeys through a personalized app.
As Shapa scaled its enterprise offering, clients struggled to manage patient data efficiently, relying heavily on manual reports and support requests.
I led the design of Shapa’s first Admin Portal: transforming fragmented workflows into a centralized, data-driven platform that enables organizations to monitor, manage, and engage their patients at scale.
The problem
Enterprise clients lacked a centralized system to manage their patients.
This resulted in:
Fragmented visibility across users and health data
Heavy reliance on support for accessing reports and insights
Inefficient workflows that slowed down treatment management
Research
Key Questions
What do enterprise clients actually need to manage patients effectively?
Where are they experiencing friction-and how severe is it?
How can we reduce dependency on support while improving outcomes?
Methods
Quantitative and qualitative support data
Guerrilla research
In-person stakeholder interviews
Key insights
01
No holistic view of patients
Clients couldn’t easily monitor progress across individuals or groups
02
Limited access to data
Downloadable reports were hard to access, delayed, or required support
03
Lack of engagement tools
No way to communicate with patients or assign actions directly
04
Different user roles, same system
Two distinct personas emerged:
Admin (day-to-day patient management)
Super Admin (higher-level configuration & oversight)
Impact
My role
In a 0→1 build, I led the design of Shapa’s Admin Portal, creating a centralized system for enterprise clients to monitor and manage patient health at scale. I combined research insights with systems thinking to define role-based environments, flexible data views, and task-oriented navigation. Working in a highly collaborative environment with product, engineering, and data, I navigated technical constraints and iterated on complex data components to ensure both usability and scalability. I drove the project from discovery through implementation, delivering a platform that reduced reliance on support and enabled more efficient, action-oriented workflows.
Platforms
Web environment
Timeline
3 months duration
Teams
Product, Engineering and QA
-60%
Reduction in support tickets
< 30 sec
Report generation time
Real-time
Patient monitoring & insights
Impact & outcomes
Shifted the experience from reactive, support-heavy workflows to a proactive, scalable system for enterprise patient management.
Support tickets reduced
Data & reporting requests
↓ 60%
Report generation
from manual → instant export
< 30 sec
Patient insights
Faster, data-driven
decisions
Real-time
Project outcome
Shifted the experience from reactive, support-heavy workflows to a proactive, scalable system for enterprise patient management.
↓ 60%
Support tickets reduced
Data & reporting requests
< 30 sec
Report generation
From manual → instant export
Real-time
Patient insights
Faster, data-driven
decisions
↓ 60%
Support tickets reduced
Data & reporting requests
< 30 sec
Report generation
From manual → instant export
Real-time
Patient insights
Faster, data-driven
decisions
Strategic direction
Enable enterprise clients to independently monitor, manage, and engage patients at scale.
This led to three strategic pillars:
Centralization – one place for all patient data
Self-service – reduce reliance on support
Actionability – turn data into meaningful interventions
Crafted with creativity, late-night iterations, Ctrl+Z reflexes, and a carefully curated playlist.
© Chen Segal 2025
Crafted with creativity, late-night iterations, Ctrl+Z reflexes, and a carefully curated playlist.
© Chen Segal 2025
© Chen Segal 2025